| Mission Statement | Packets | Welcome Packet | Partner Packet | Home |
Stock Selection Guide
![]()

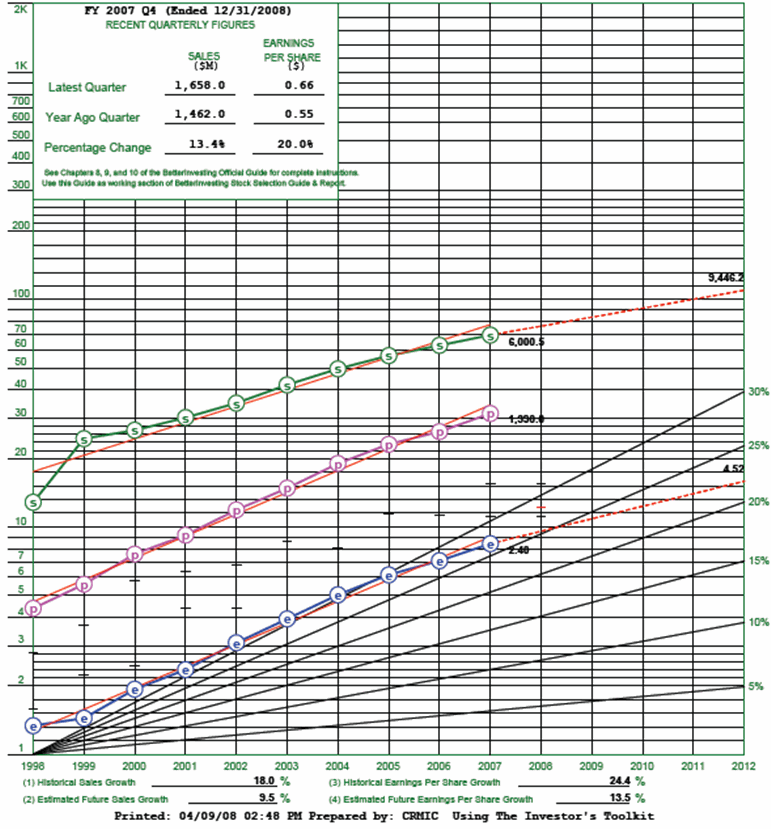
VISUAL ANALYSIS OF SALES, EARNINGS, PRETAX PROFIT MARGIN, AND PRICE: SECTION 1 OF THE SSG
GENERAL INFORMATION
SALES:
Sales growth, known as the top line in a company's operation, is the most predictable of the statistics that you analyze because very few short-term factors impact it - especially for a company with annual sales over $100 million. The healthiest growth is organic, growth generated by marketing or through research and development (R&D). Marketing brings in new customers for a company, and R&D adds more products or services for the company to sell.
EARNINGS:
Earnings growth is apt to be less predictable than sales growth because it is affected not only by the factors that influence sales growth but also by factors such as increases in energy or raw materials costs. These factors chop away at the profit before they reach the bottom line in a company's operations. Earnings are affected not only by sales and expenses but also by changes in the number of outstanding shares. Distributing more stock can lower the earnings per share. Conversely, buying back shares of stock can raise the earnings per share. These increases and decreases make sense if you remember that earnings per share are calculated by dividing the net profit (what remains after all expenses including taxes are paid) by the number of shares outstanding. Earnings can also grow faster than sales when the income tax rate comes down.
Because of factors like these, the rate of earnings growth can--for a limited period--vary above or below the rate of sales growth. Rarely, however, can a company sustain a rate of earnings growth greater than the rate of sales growth. Ideally, the rates of change in sales, pretax profit, and earnings should move in tandem. If sales, earnings, and pretax profit lines are going in different directions, look for another company. This is not a high quality growth company showing consistent growth.
GUIDELINES FOR JUDGMENT
OUTLIERS:
- Use the history of the sales and earnings record of the company to predict future growth and use only the data that is relevant from the past history of the company. To create a better "fit" in your historical data, delete outliers in years that reflect irrelevant data such as non-recurring events.
- Irrelevant earnings factors come from non-recurring events such as the following: the sale of a building, costs associated with the settlement of a lawsuit, an acquisition incurring integration costs such as facility closures or severance pay due to staff reductions. The increased income or costs would show up as a sharp spike or dip on the historical earnings trend line.
- An irrelevant factor in sales follows: If a company exhibited explosive sales growth in the early years and the growth stabilized during the most recent years, the early years of explosive growth are not relevant when using historical growth as an indicator of future growth. Remove the early years of explosive growth to gain a truer picture of where the sales growth will be heading in the future.
- Be suspicious of any deletions that increase the historical growth rate. As a corollary, consider eliminating only the outliers that decrease the historical growth rate. Stated another way, if deleting the outlier decreases the historical growth rate, then it probably makes sense to delete it.
SALES GROWTH:
- In determining sales growth, keep predictions at or near historical figures, because the future growth of a company rarely exceeds its historical growth. However, if explosive growth occurred in the early years of a company’s history, it cannot be sustained over the long haul. Thus, your predictions should not be near historical figures if there was explosive growth. Make a more conservative prediction of future growth.
- When projecting five-year future growth rate in sales, 15%-20% is probably the maximum sustainable growth rate. The only company in American business history that was able to grow at 15% or higher for 15 consecutive years was IBM in the 1950s and 1960s. See chart for Expected Growth of Companies.
- Note whether the most recent five-year historical period shows sales trending up or down and be conservative in your five-year future sales growth rate prediction.
- Remember, as a company grows larger, it becomes increasingly difficult to maintain high growth rates.
EARNINGS GROWTH:
- Always use diluted earnings - not basic earnings - when analyzing a company. Diluted earnings reflect the result of distributing earnings among all possible shares. This offers the worst-case scenario of earnings and represents the most conservative approach to assessing the company's performance.
- In determining earnings growth, also keep 5-year future predictions at or near the historical figures but rarely exceed 15-20% since very few companies can sustain growth at a higher rate for more than a few years. Remember, the future growth of a company rarely exceeds its historical growth. Explosive growth sometimes occurs in the early years of a company’s history, but it cannot be sustained over the long haul.
- In general, do not project your future earnings per share growth more than your future sales growth.
- Again, note whether earnings are trending up or down during the company's most recent five-year history and be conservative in your five-year future earnings growth rate prediction.
- Remember, as a company grows larger, it becomes increasingly difficult to maintain high growth rates.
PREFERRED PROCEDURE:
The Preferred Procedure develops an estimate of what future earnings growth can be in a company by looking at sales – not earnings. It is a conservative method and is a reality check for a projection based on historical growth. Historical sales growth tends to be more consistent and stable than historical earnings growth. Remember, earnings are derived from revenues after deducting costs, taxes and preferred dividends.
To calculate earnings five years into the future, do the following:
- Using the 5-year projection for sales, subtract expenses, then subtract taxes, and then subtract preferred dividends. This gives you the projected 5-year total earnings.
- The result (the projected 5-year total earnings) is then divided by the numbers of shares outstanding to determine earnings per share.
A novice investor should not be concerned with this procedure until gaining more investing experience.
RULE OF THUMB FOR FUTURE EARNINGS GROWTH:
- Future earnings growth should not exceed future sales growth.
- Think twice before projecting earnings to grow faster than sales. Although it is not uncommon for earnings to grow faster than sales historically, it probably makes sense to limit projections for future earnings growth to mirror sales growth projections.
RULE OF THUMB FOR GROWTH PROJECTION:
- Double check your sales and earnings projections against those of the analysts, but make sure they fall below those of the analysts. The analysts tend to be fairly liberal in their projections of future growth. Analysts’ projections are found on Value Line Reports in the left hand column under the section titled “Annual Rates”.
- Never increase your projections to meet those of the analysts.
BENCHMARKS FOR SALES AND EARNINGS GROWTH:
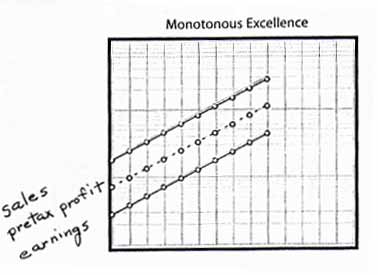
- When examining the company's ten years of historical growth in sales and earnings as shown in Section 1 of the SSG, look for stability shown by relatively straight lines. This is demonstrated in the figure entitled Monotonous Excellence at the top of the Visual Analysis Section.
- The straighter the line showing growth, the more predictable it is and the more consistent the growth is.
- The steeper the slope, the stronger growth is.
- "Saw teeth" - jagged ups and down - show a chaotic history.
BENCHMARKS FOR PRETAX PROFIT BARS: You can see trends in the profit margin by looking at changes in the space between the pretax profit and the sales lines.
- An increase in the size of that space indicates an increase in the portion of sales that goes to expenses. This means that there is a decrease in the profit margin.
- Conversely, the narrower the space becomes between the pretax profit and the sales lines, the smaller the percentage going to expenses and the greater the profit margin.
- When you see a change in earnings growth on the visual analysis, you can tell by looking at the pretax profit line and sales line whether the change in earnings growth is caused by changes in the profit margin or by increases or decreases in the number of shares outstanding. More detailed information is provided about this concept in the section titled Advanced Benchmarks for Visual Analysis of Sales, Earnings, and Pretax Profit Margin: Front Side of SSG.
- Remember, the number of shares outstanding has a considerable effect on earnings. A reduction in shares (by a company’s buying back its shares) will increase earnings per share, and an increase in shares (by a company’s offering more shares of a stock) will reduce earnings per share. More detailed information is provided about this concept in the section titled Advanced Benchmarks for Visual Analysis of Sales, Earnings, and Pretax Profit Margin: Front Side of SSG.
BENCHMARK FOR PRICE BARS:
- Price bars should progress upward. Check to see if the price has doubled in the last five years.
- When price bars are plotted above the EPS line, you can see the "price over the earnings" or the P/E (price divided by the annual earnings per share) ratios.
- The further the price is from the EPS, the larger the P/E. The closer the price is to the EPS, the smaller the P/E.
- If the price bar extends below the earnings line, the P/E is 10 where it touches the line.
- Any time higher-than-normal P/Es are paid, even for good companies, you risk disappointment by not achieving your goal of doubling your investment in five years.
- Prices always seem to come
back to "normal" at some point in time.
ADVANCED BENCHMARKS FOR VISUAL ANALYSIS OF SALES, EARNINGS, AND PRETAX PROFIT MARGIN: FRONT SIDE OF SSG

SLOPE OF SALES & EARNINGS LINES: Comparison of the slope of the sales and Earnings lines can tell you interesting things about the direction in which a company is headed.
- Are they moving in concert? Sales and earnings lines running pretty much parallel to each other indicate that management is probably controlling its costs efficiently and capably.
- Barring the repurchase or issuance of shares or the unlikely benefits of a tax break, are the profit margins fairly stable? If so, this indicates that expenses and, therefore, profits, are increasing right along with revenues.
SALES GROWTH AND TAX RATE IMPACT:
- If sales are growing at a faster rate than earnings and pretax profit is growing at a rate closer to earnings than to sales, the profit margin is likely decreasing - a bad sign. See Diagram 1. This situation can occur, too, if there has been an increase in the tax rate.
- If sales are growing at a faster rate than earnings and pretax profit is growing at a rate closer to sales than earnings, then the number of shares has been increasing. See Diagram 2. This situation can occur, too, if there has been an increase in the tax rate.
|
|
|
|
|
Bad Sign - Profit Margin is likely decreasing or tax rate is increasing. |
|
Number of shares has been increasing (dilution) of there is an increase in the tax rate. |
EARNINGS GROWTH AND TAX RATE IMPACT:
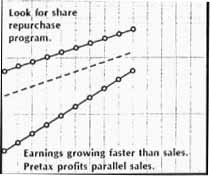
- If earnings are growing at a faster rate than sales and pretax profit is growing at a rate closer to sales than earnings, then the number of shares has likely been decreasing as the company repurchases them. See Diagram 3. This situation can occur, too, if there has been a decrease in the tax rate.
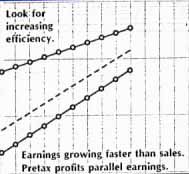
- If earnings are growing at a faster rate than sales and pretax profit is growing at a rate closer to earnings than to sales, the profit margin is likely increasing - usually a good sign. See Diagram 4. This situation can occur, too, if there has been a decrease in the tax rate - still a good sign but not likely, at least for the long term.
TAX RATE: Remember, changes in the tax rate are the least likely reasons for dissimilarities in growth rate - especially when the dissimilarities persist for more than a single year. Uncle Sam and his cohorts in the statehouses are not prone to bestowing gifts on industry. Factors such as carryover losses, in which the full tax benefit of a loss could not be claimed in the year of the loss, can distort the otherwise normal role of taxes in the progression from the top to the bottom line.
|
Probably company has been buying its shares or there is a decrease in the tax rate. |
|
Good Sign - Profit Margin is probably increasing or there is a decrease in the tax rate. |
Sources:
Take Stock, Ellis Traub, 2001
Better Investing Magazine, various articles
Starting and Running a Profitable Investment Club, Thomas E. O'Hara and
Kenneth S. Janke, SR., 1998
Investors Toolkit, 3rd and 4th editions, Inve$tWare Corporation
2000 NAIC Congress and Expo, Philadelphia, PA, Cassette Tapes
The Fool.com: Insider and Institutional Holdings


