| Mission Statement | Packets | Welcome Packet | Partner Packet | Home |
Stock Selection Guide

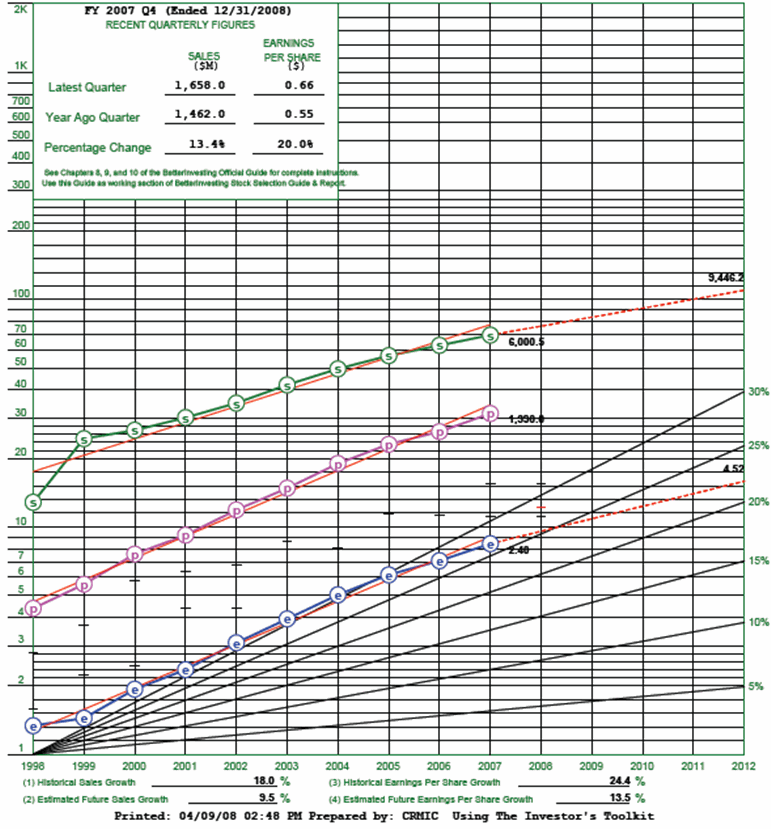
Following is Section 1 of a sample Stock Selection (SSG) Guide for Stryker Corporation. Below the SSG, you will find the Basic Benchmarks for Section 1 of the SSG.
![]()
RECENT
QUARTERLY FIGURES: FRONT SIDE OF SSG (Upper left hand corner of graph)
|
1 VISUAL ANALYSIS of Sales, Earnings and Price
|
This section compares the Sales and Earnings figures of the most recently completed quarter to the same quarter a year ago.
Benchmark: Investors like to see at least a 10% change in both Sales and Earnings from the year ago quarter.
Benchmark: The percentage increases for both Sales and Earnings should be close to the historical and projected growth rates.
Note: Quarterly performance does not carry the weight that annual (or trailing four-quarter) data do because anything can happen in a single quarter and never recur. However, downward movement can be a warning bell. Look at the most recent quarterly figures for sales and earnings and then look at the historical sales and earnings figures (at the bottom of the front side of the SSG) to see if the most recent quarterly figures are in line with the historical figures of the past 10 years. Always look for trends in sales and earnings. If there is a downward trend, give the company one or two more quarters to see if it can reverse the trend.
HOW TO CALCULATE
YEAR AGO PERCENTAGE CHANGE IN SALES AND EARNINGS PER SHARE
Step 1: For both Sales and Earnings Per Share: Subtract the Year Ago Quarter figure from the Latest Quarter figure to get the difference from last year to this year.
Step 2: Divide the difference by the Year Ago Quarter figure and move the decimal point two places to the right. This is the percentage change from the year ago quarter.
An example:
|
Step 1: |
Sales: |
1658.0 Latest Quarter |
|
Earnings Per Share: |
0.66 Latest Quarter |
|
Step 2: |
|
196.0 / 1462.0 = 0.1340 or 13.4% |
|
|
0.11 / 0.55 = 0.200 or 20.0% |
Interpretation: The Sales increased by 13.4% from the year ago quarter and the Earnings Per Share increased by 20.0% from the year ago quarter. Both meet the standard of increasing 10% or more from the year ago quarter.
